Identifying Support and Resistance Levels
What are support and resistance levels in technical analysis?
Support and resistance are key concepts in technical analysis, describing price levels where a
security tends to stop and reverse direction.
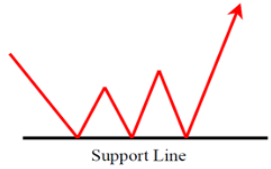
Support
Definition: A price level where a downward trend pauses due to increased demand.
Behaviour: Prices typically „bounce“ off this level. If breached, the price may continue to fall
until finding another support.

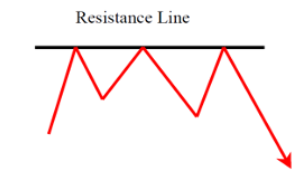
Resistance
Definition: A price level where an upward trend pauses due to increased selling interest.
Behaviour: Prices typically „bounce“ off this level. If breached, the price may continue to rise
until finding another resistance.

Proactive vs. Reactive Support and Resistance
Proactive Methods
- Predictive: Identify areas where price might react in the future.
- Examples: Elliott Wave, Fibonacci, Calculated Pivots, Trendlines, Moving Averages, VWAP, Market Profile (VAH, VAL, POC).
Reactive Methods
- Based on Past Price Action: Formed from historical price or volume behavior.
- Examples: Volume Profile, Price Swing Lows/Highs, Initial Balance, Open Gaps, OHLC.
Identifying Support and Resistance Levels
- Trend Lines: Used to identify support/resistance.
- Pivot Points: Calculated levels based on price action.
- Testing: The more a level is tested and holds, the stronger it is.
- Role Reversal: When a level is broken, it often reverses roles—support becomes resistance and vice versa.
Methods to Determine Support and Resistance
- Price Histogram: Shows price levels where the market has spent significant time.
- Psychological Levels: Round numbers often act as support/resistance.
- Volatility: Recently used to calculate potential support and resistance levels.
Role Reversal
- Mechanism: When a support/resistance level is significantly broken, it often reverses its role—support turns into resistance and resistance into support.