Uptrend, Downtrend and Sideways Trend
What is a Trend Line in Technical Analysis?
A trend line is formed by drawing a diagonal line between two or more price pivot points, commonly
used to determine entry and exit points when trading securities. It acts as a boundary for the price
movement of a security.
Support and Resistance Trend Lines
Support Trend Line: Formed when a security’s price decreases and rebounds at a pivot point aligning
with at least two previous support pivot points.
Resistance Trend Line: Formed when a security’s price increases and rebounds at a pivot point aligning
with at least two previous resistance pivot points.
Types of Trends
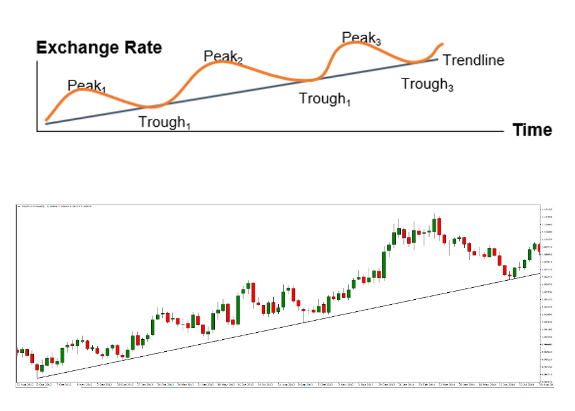
Uptrend
Definition: A series of consecutive higher peaks and higher troughs.
Construction: Connect two or more higher lows and extend the line into the future to act as support.
Signal: Indicates bullish sentiment, suggesting prices are likely to increase.
Strategy: Traders buy near the pullbacks to the trend line.
Example of an upward trend line:

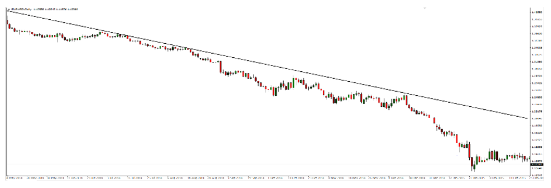
The Downtrend
Definition: A series of consecutive lower peaks and lower troughs.
Construction: Connect two or more lower highs and extend the line into the future to act as resistance.
Signal: Indicates bearish sentiment, suggesting prices are likely to decrease.
Strategy: Traders sell near the corrective rebounds to the trend line.

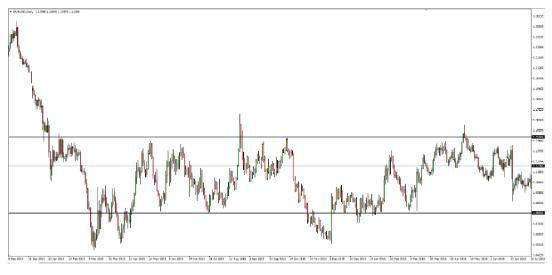
The Sideways Trend
Definition: Identified by drawing two parallel trend lines, forming a trading range rectangle.
Behaviour: Prices trade horizontally with neither bulls nor bears in control.
Strategy: Traders buy near the lower end of the range and sell near the upper end.

Using Trend Lines
Trend lines are a simple and widely used technical analysis tool. They require historical data,
typically presented in chart form. While historically drawn by hand, modern charting software allows
for computer-based drawing, with some software automatically generating trend lines. Most
traders, however, prefer to draw their own.
- Chart Interval: Choose a chart based on an interval period aligning with your trading
strategy. Short-term traders use intervals like 1 minute, while long-term traders use hourly,
daily, weekly, or monthly intervals. - Application: Trend lines can be used on price charts and various technical analysis charts,
such as MACD and RSI, to identify positive and negative trends. - Positive Trend: Forms an upsloping line when support and resistance pivot points align.
- Negative Trend: Forms a downsloping line when support and resistance pivot points align.