Candlestick Patterns and their Meaning
Understanding Candlestick Charts and How to Read Them
The opening, high, low, and closing prices of the day combine to form a candlestick. A filled candlestick
is drawn if the opening price is greater than the closing price.
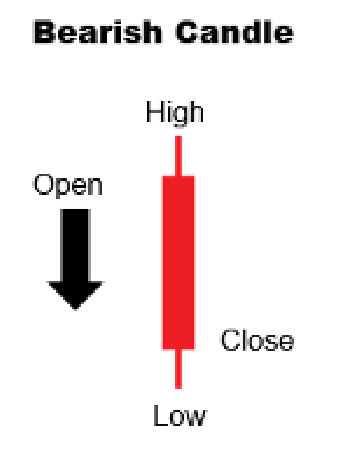
Black (or red) colour is used to fill the candle. If the closing price is higher than the opening price, a
hollow candlestick (often represented in white with a black border or in full green) is drawn.
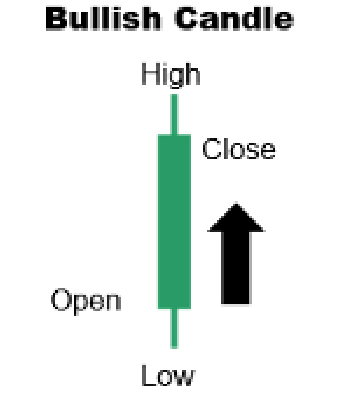
The body of a candle can be long, normal, or short and is proportionate to the lines above or below it.
These lines, known as shadows, tails, or wicks, indicate the high and low price ranges. The top of the
upper shadow shows the highest price of the day, while the bottom of the lower shadow shows the
lowest price. Note that a candle may or may not have shadows, tails, or wicks.
Candlestick formations
Doji Candlestick
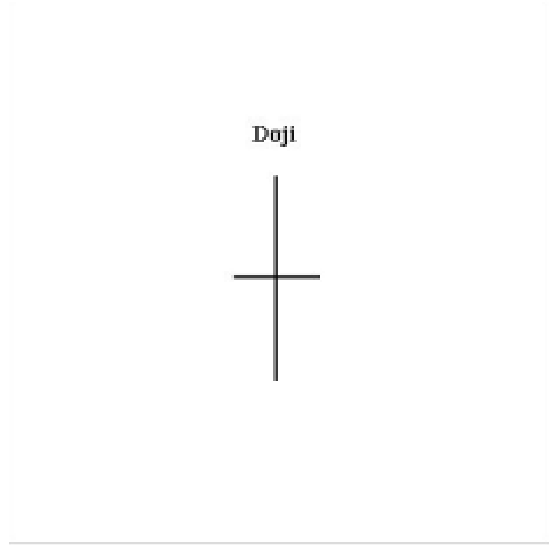
Description: Formed when opening and closing prices are nearly identical.
Shadows: Varying lengths.
Significance: Part of many candlestick patterns.
Dragon Fly Doji
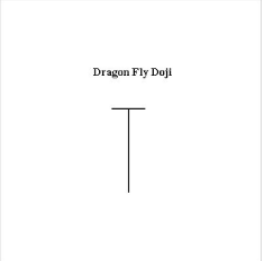
Description: Opening and closing prices are at the highest of the day.
Trend: Longer lower shadow indicates a bullish trend.
Signal: Reversal at market bottoms.
Gravestone Doji
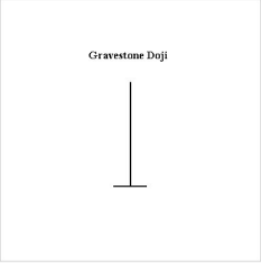
Description: Opening and closing prices are at the lowest of the day.
Trend: Longer upper shadow indicates a bearish trend.
Signal: Reversal at market peaks.
Long Legged Doji
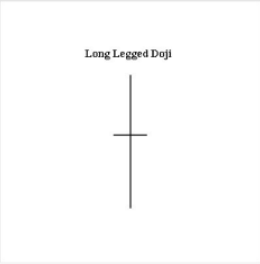
Description: Doji with long upper and lower shadows.
Signal: Reversal at market peaks.
Hanging Man
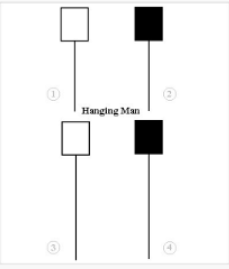
Description: Small body near the top, long lower tail, little or no upper shadow.
Trend: Bearish during an uptrend.
Hammer
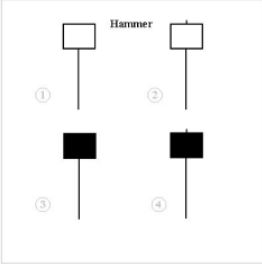
Description: Small body near the top, long lower tail, little or no upper shadow.
Trend: Bullish during a downtrend.
Inverted Black Hammer
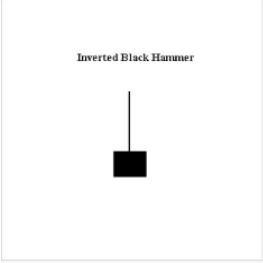
Description: Black body, upside-down hammer position.
Signal: Bottom reversal, needs confirmation.
Inverted Hammer
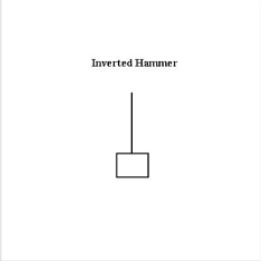
Description: Upside-down hammer-shaped candlestick.
Trend: Bullish reversal in a decline.
Long Lower Shadow
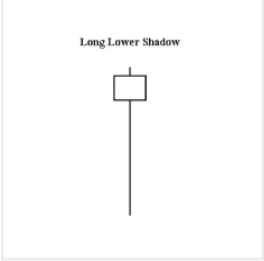
Description: Lower tail is 2/3 or more of the candlestick.
Signal: Bullish near price support levels.
Long upper shadow
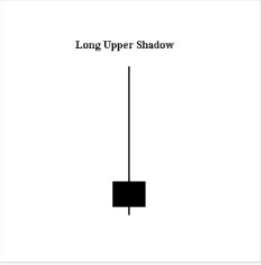
Description: Upper shadow is 2/3 or more of the candlestick.
Signal: Bearish near price resistance levels.
Marubozu
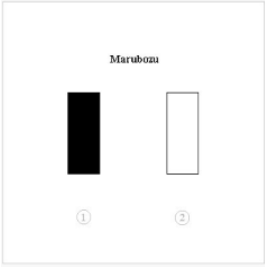
Description: Long candlestick with no shadows.
Trend: Continuation pattern.
White Marubozu: Bullish.
Black Marubozu: Bearish.
Shooting Star
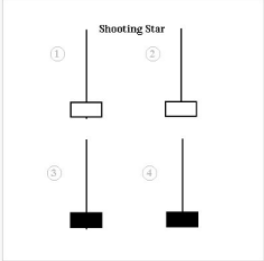
Description: Short body, long upper shadow, little or no lower tail.
Trend: Bearish reversal in an uptrend.
Spinning Top
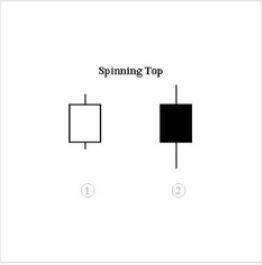
Description: Small body, varying shadow lengths.
Significance: Neutral, but important with other patterns.
Trend: Potential reversal in a downtrend.
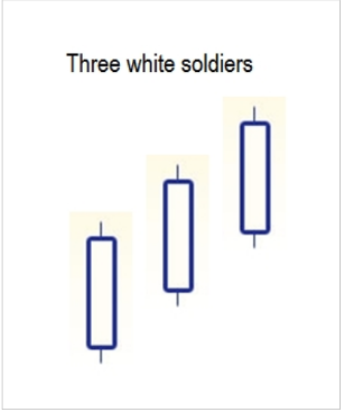
Three White Soldiers
Description: Three long white candlesticks trending upward.
Trend: Bullish reversal from a bear market.
Three Black Crows
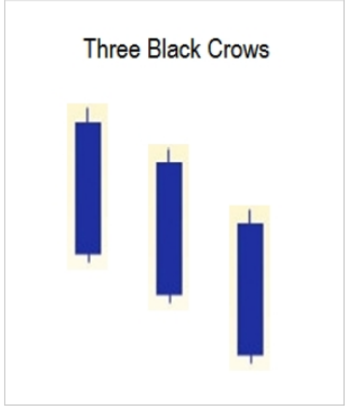
Description: Three long black candlesticks trending downward.
Trend: Bearish reversal from a bull market.
Morning Star
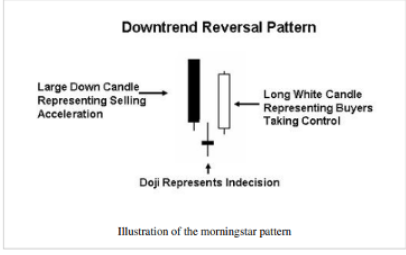
Description: Three-candle pattern (long bearish, short doji, long bullish).
Trend: Potential reversal in a downtrend.