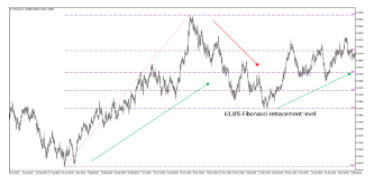
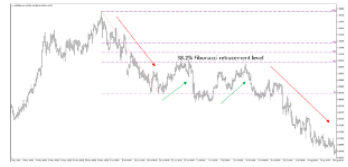
What are Fibonacci Retracements
The Fibonacci Sequence is a numerical sequence beginning with 0 and 1, where each subsequent
number is the sum of the two preceding ones: 0, 1, 1, 2, 3, 5, 8, 13, 21, 34, 55, 89…
Fibonacci Ratios are derived from this sequence by dividing any number by the one immediately
following it:
- 61.8% (Golden Ratio): The most significant Fibonacci ratio.
- 38.2%: Found by dividing a number by the one after two places.
- 23.6%: Derived by dividing a number by the one after three places.
- 50%: Another notable Fibonacci level.

Fibonacci Levels are drawn by connecting two extreme points on a chart and dividing the vertical
distance by these key Fibonacci ratios. They serve as critical support and resistance levels during a
retracement, which is a temporary reversal against the prevailing trend.
- 0.0%: Marks the beginning of the retracement.
- 100.0%: Represents a complete reversal back to the original move.
- 38.2% and 61.8%: Considered the most significant Fibonacci retracement levels due to their frequent relevance in market movements.

Fibonacci Retracements are a technical analysis tool used to identify potential support and
resistance levels. Based on the Fibonacci sequence, this method assumes that markets tend to
retrace a predictable portion of a previous move before continuing in the original direction. Traders
draw horizontal lines at these Fibonacci levels on a chart to pinpoint where price movements may
stall or reverse.
Applying Fibonacci Retracements
1. Identify Extremes: Locate two significant points on a price chart that define the trend.
2. Calculate Retracement Levels: Measure the vertical distance between these points and apply
Fibonacci ratios (38.2%, 61.8%, etc.) to divide this distance.
3. Draw Levels: Plot horizontal lines at these Fibonacci levels to visualize potential support and
resistance zones.
4. Trading Strategy: Use Fibonacci retracement levels to determine entry and exit points, as
well as to set stop-loss orders based on expected price reactions around these levels.
Conclusion
Fibonacci retracements offer traders a systematic approach to identifying key levels where price
movements are likely to pause or reverse. By leveraging the mathematical relationships inherent in
the Fibonacci sequence, traders can enhance their technical analysis toolkit to make informed
trading decisions based on historical price behaviour.