The Head and Shoulders Pattern
The Head and Shoulders pattern is widely recognised as a prominent reversal formation in technical
analysis. When a price trend is undergoing reversal from either a bullish or bearish direction on a chart,
this distinctive pattern emerges.
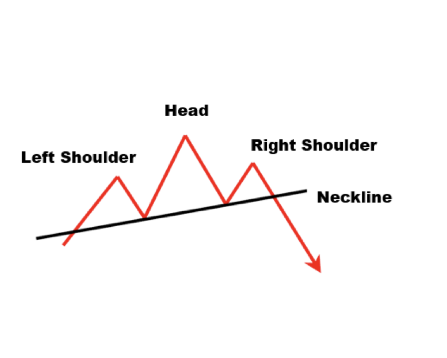
In a Head and Shoulders Top formation, the pattern consists of three main components: a left
shoulder, a head, and a right shoulder, delineated by a neckline.
The left shoulder forms at the end of a significant upward movement, often accompanied by high
trading volume. Following the peak of the left shoulder, prices experience a corrective decline on
relatively low volume. Subsequently, prices rally again to form the head, typically accompanied by
normal to heavy trading volume. The subsequent decline from the head is usually on lower volume.
The right shoulder forms as prices rise once more but fail to exceed the high of the head, remaining
below the peak of the head and falling nearly to the level of the low point between the left shoulder
and the head, or at least below the peak of the left shoulder. Volume during the formation of the right
shoulder is generally lower compared to both the left shoulder and the head.
A neckline is drawn across the lows of the left shoulder, the head, and the right shoulder. Confirmation
of the Head and Shoulders Top formation occurs when prices break below this neckline after forming
the right shoulder. It is common for prices to retest the neckline before continuing their downward
trend.

Inverted Head and Shoulders
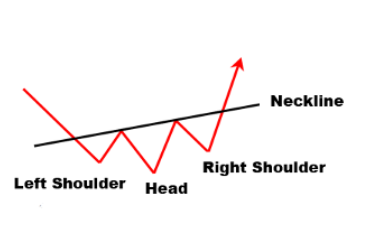
The Inverted Head and Shoulders pattern is essentially the opposite of a Head and Shoulders Top,
often signalling a shift in trend and sentiment. This formation appears upside down on a chart and
exhibits a different volume pattern compared to a Head and Shoulders Top.
Prices initially decline to form the first low, accompanied by increased volume, marking the
completion of the left shoulder. Subsequently, prices drop further to a new low. A recovery phase
follows, characterized by relatively higher volume than seen previously, completing the head
formation. A corrective pullback on lower volume then begins to form the right shoulder. The pattern
is finalized with a strong upward movement on heavy volume, breaking through the neckline.
Unlike Head and Shoulders Top formations that typically complete within a few weeks, a major
Inverted Head and Shoulders (including the left shoulder, head, and right shoulder) often takes longer,
spanning several months or even more than a year.

The neckline drawn across the lows of the left shoulder, head, and right shoulder serves as a crucial
support level. Confirmation of the Inverted Head and Shoulders formation occurs when prices break
above this neckline, ideally on increased volume. However, it’s essential to note that a breakthrough
the neckline on significantly higher volume (more than three to four percent) should be monitored
closely, as it may indicate a significant market move.
Key Characteristics:
Inverted Head and Shoulders formations are often not perfectly symmetrical, tilting slightly upward
or downward.
One shoulder may appear lower than the other.
The time involved in forming valleys can cause one shoulder to appear broader than the other.
The neckline may not be perfectly horizontal; it could ascend or descend.
If the neckline is ascending, a key criterion is that the lowest point of the right shoulder must be
notably lower than the peak of the left shoulder.
Usage as a Tool:
After confirmation, the Inverted Head and Shoulders pattern is highly useful for estimating and
measuring the potential extent of the subsequent move from the neckline. Traders often measure the
distance from the head peak to the neckline and then project a similar distance upward from the
neckline after the right shoulder completes. This provides a minimum target for how far prices could
rise after the formation completes.